CLI & Core
- Add
parallel action for making parallel requests in HTTP tests
Fargate
- Add ability to suppress metrics output with
--quiet flag - docs
- Add
eu-north-1 to supported regions
Lambda
- Add ability to suppress metrics output with
--quiet flag - docs
Playwright
- Fix issue preventing stack traces for errors from being displayed
- Update Playwright version to
1.43.1 - docs
Publish Metrics
- Make reporters using OpenTelemetry compatible with parallel requests
Publish Metrics
- Sending traces to AWS X-Ray is now available through the CloudWatch reporter
- Allow replacing of all tracing span names with
replaceSpanNameRegex config option - Docs
- Fix bug in Datadog reporter causing last batches of traces to occasionally drop
- Fix errors happening when
sampleRate tracing option set
- Fix errors in tracing happening when using HTTP streaming
- Display number of spans exported in the Artillery report (
plugins.publish-metrics.spans.exported ) when tracing is enabled
CLI & Core
- Fix incorrectly declared dependencies in Artillery CLI
Artillery Cloud
- Fix issue preventing
ARTILLERY_CLOUD_API_KEY environment variable from being picked up by Fargate when using --dotenv
Metrics by Endpoint
- Report request URLs for requests that resulted in a network error such as
ETIMEOUT or ECONNRESET - docs
CLI and Core
- Fix issue causing some intermediate reports to not be reported
- Fix issue with incorrect formatting of time units in “phase started” messages
CLI and Core
- Add support for loading custom code from ES modules - docs
- Add support for using
async functions as hooks - docs
Playwright
- Update Playwright version to 1.42.1
- Fix bug that prevented traces from Playwright tests from being sent to Datadog and Honeycomb
AWS Fargate
Playwright
- Make
expect from @playwright/test work natively with Typescript support - Documentation
- Use
target as Playwright’s baseURL by default, allowing test scripts to include only relative paths in page navigations (e.g. page.goto('/docs') ) - Documentation
- Update Playwright version to 1.41.2 - Documentation
Artillery Cloud
- Fix missing phase events in Artillery Cloud when running Fargate tests
CLI & Core
- Improve Typescript support to work with more packages, by exposing
config.bundling.external to set packages that can’t be bundled as external - Documentation
- Make test run id available to test runs via
{{ $testId }} in scenarios/config and vuContext.vars.$testId in custom code
- Routine dependency updates
Publish Metrics
- Automatically send all traces and metrics sent via the
opentelemetry reporter with a test_id attribute, making it easier to search for all relevant data from a particular test run
Fargate
- Improve error message and handling for putting CloudWatch retention policy
You can now invite new team members and manage existing membership from one screen.
See usage stats and limits
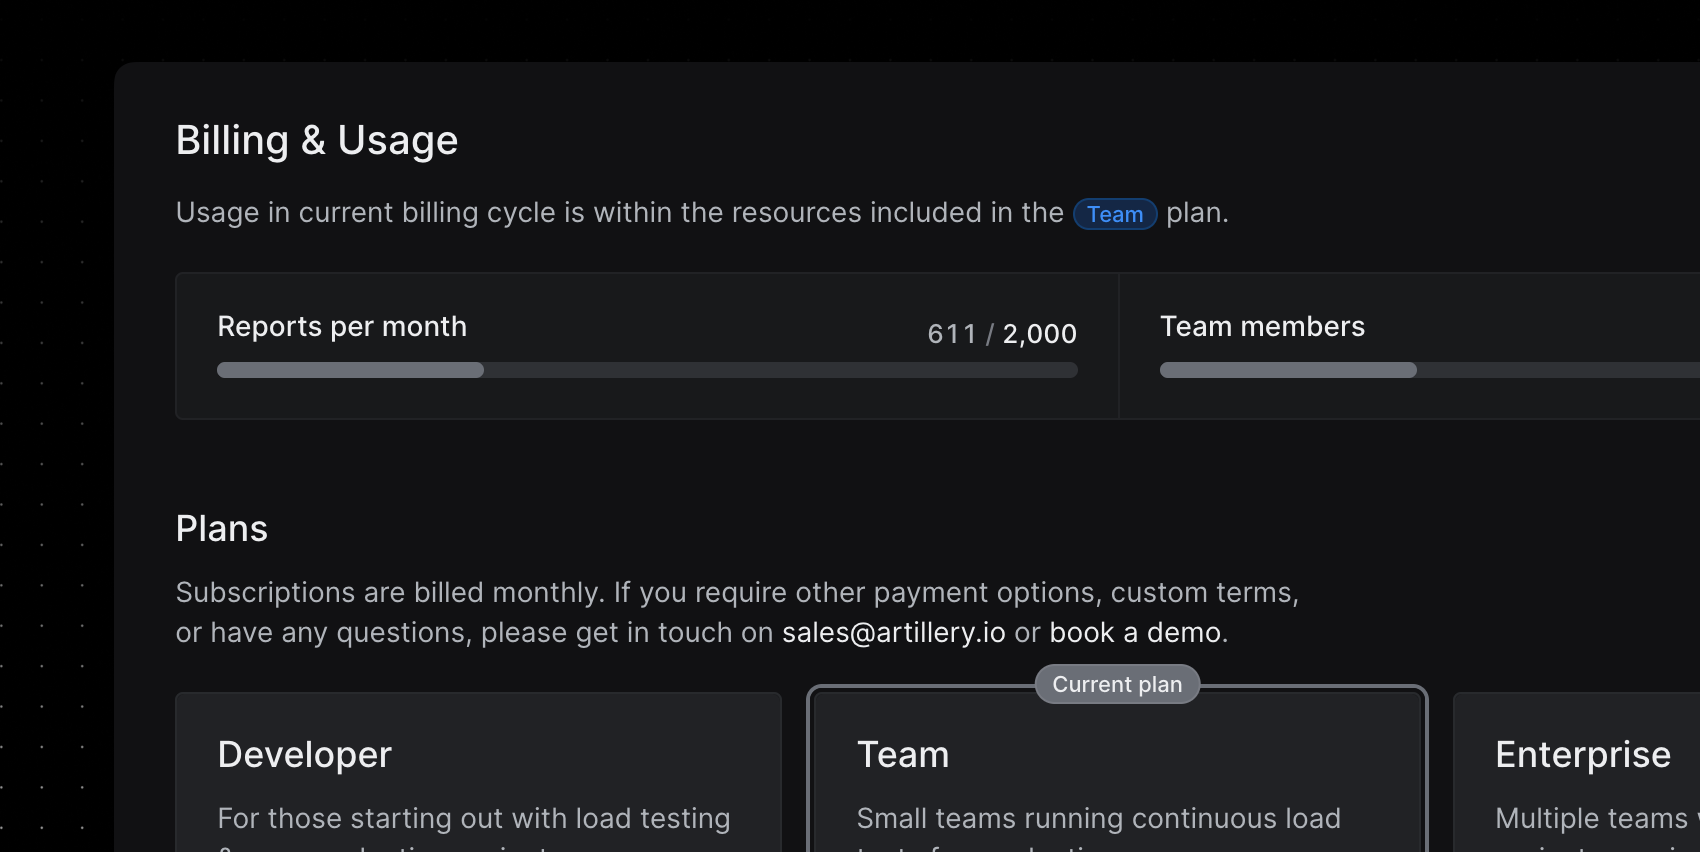
You can see how much of your plan’s quota your organization is using in the new usage stats section in the Billing page. There’s also a new FAQ section to help with any questions you might have around usage limits.
Filter by Date improvements
Filter by date gets a new navigation, with improvements for selecting dates across multiple months. There’s a new Last 7 days shortcut too.
Organization dropdown updates
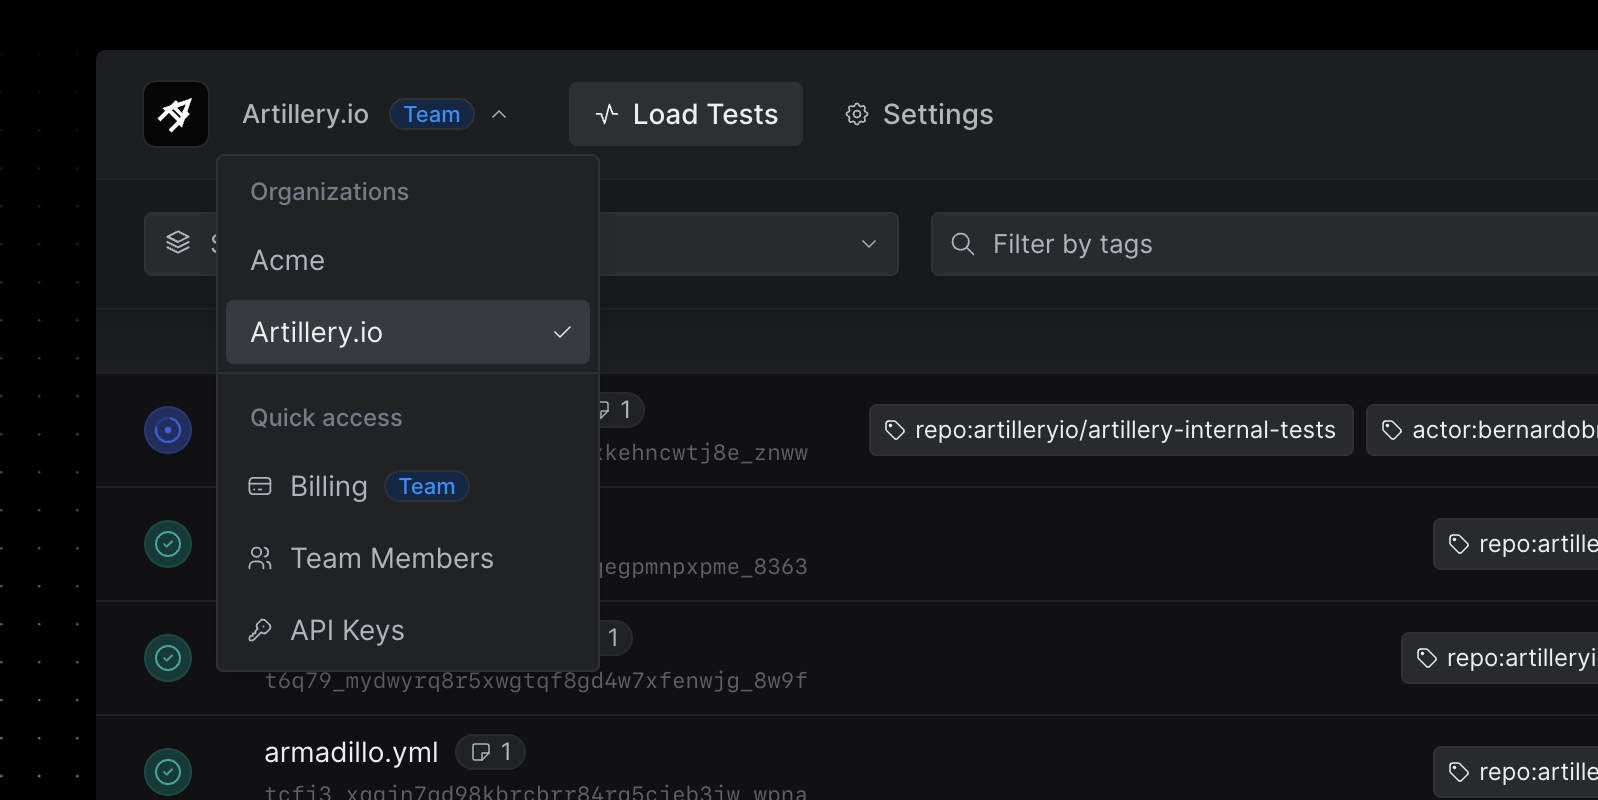
There’s a new quick access area with links to Billing, Team Members, and API Keys in the organization dropdown. You can now see your current billing plan too.
- Add support for displaying INP web vital — available when using Artillery ^2.0.5
- Improve web vital metric comparison between different URLs
- Show load phases on Page performance charts
Load Test reports improvements
- Move navigation to the right side of the page to match Overview page layout
- Fix charts not aligning on top of the page when navigating to report
- Charts now have the same width as the Load test Overview page
Charts improvements
- Fix label overlapping columns on HTTP response distribution chart
- Fix load phase labels clipping on chart edges
- Improve Y Axis label formatting for all charts
Bug fixes and improvements
- Improve Dialogs and Modals design and add keyboard shortcut to close them
- Improve settings navigation on small screens
- Improve loading speed of the Load Test page
- Improve code snippets formatting on test notes
- Improve Load Tests Notes indication: much more visible and easier to spot what tests have notes
- Fix “Add note” having a line-break on some screen sizes
- Fix missing data labels on HTTP performance chart
Artillery will now aim to release a new CLI version every first and third Monday of each month, when possible.
Artillery Cloud
- Fix bug causing only one of the links to worker logs to be displayed in Artillery Dashboard
Playwright
- Update Playwright version used by Artillery to v1.41.0 - Documentation
- Add support for configuring Playwright’s
testIdAttribute setting - Documentation
- Add INP to core web vital metrics reported by Artillery - Documentation
- Enable
headless mode by default when running in Fargate, as headed mode is not compatible with Fargate
Fargate
- Improve Fargate startup logic to prevent bug where workers would hang
- Fix bug where Fargate tests running on Windows would crash trying to resolve paths to dependencies in folders
- Set default bucket lifecycle policy for S3 bucket containing artifacts from test runs - Documentation
- Set default retention policy (180 days) on Cloudwatch Logs generated during runs, with override possible - Documentation
- Add support for running using Fargate Spot by using the
--spot flag - Documentation
Lambda
- Fix Lambda bundle size issue preventing all Lambda tests from running
- Add default bucket lifecycle policy (2-7 days retention) for S3 bucket containing artifacts from test runs - Documentation
CLI & Core
- Fix
$randomString(length) utility to return correct number of characters and allow length larger than 10
Publish Metrics
- Fix bug in Fargate tests where traces sent with OpenTelemetry reporter would not arrive or arrive inconsistently formatted to observability platforms
- Add tracing support for the Datadog, New Relic and Dynatrace reporters using OpenTelemetry
- Improve traces sent via Honeycomb reporter to be proper traces with full metadata, exceptions, events, etc
Fargate
- Enable support for 12 more AWS regions (
eu-west-2, eu-west-3, us-east-2, us-west-2, ca-central-1, ap-east-1, ap-northeast-2, ap-southeast-1, ap-southeast-2, ap-northeast-1, me-south-1, sa-east-1 )
- Add support for sending Playwright and HTTP traces to Datadog APM - Documentation
- Add support for
--variables flag in run-fargate command - Documentation
- Show supported regions when using the
--region flag
CLI & Core
- Add TypeScript support for custom code for tests running locally or on AWS Fargate. This is an experimental feature. - Documentation
Playwright
- VUs will now run in isolated browsers contexts rather than new browser instances by default for better performance - Documentation
- HTTP status codes are now tracked and reported through the
browser.page.codes.<code> metric - Documentation
- Fix bug in
before/ after hooks that prevented the Playwright engine from working - Documentation
- Add experimental TypeScript support. See the docs for current limitations - Documentation
OpenTelemetry
- Fix issue with virtual users not failing when using
test.step() with OpenTelemetry Playwright tracing enabled
- OpenTelemetry tracing can now be used to send HTTP and Playwright engine traces to Datadog in Fargate tests - Documentation
- Add support for smart sampling when using HTTP tracing with the OpenTelemetry reporter
Unique sharing URLs can now be generated for test reports. This is useful for sharing test reports with people outside of your team on Artillery Cloud.
Page performance improvements
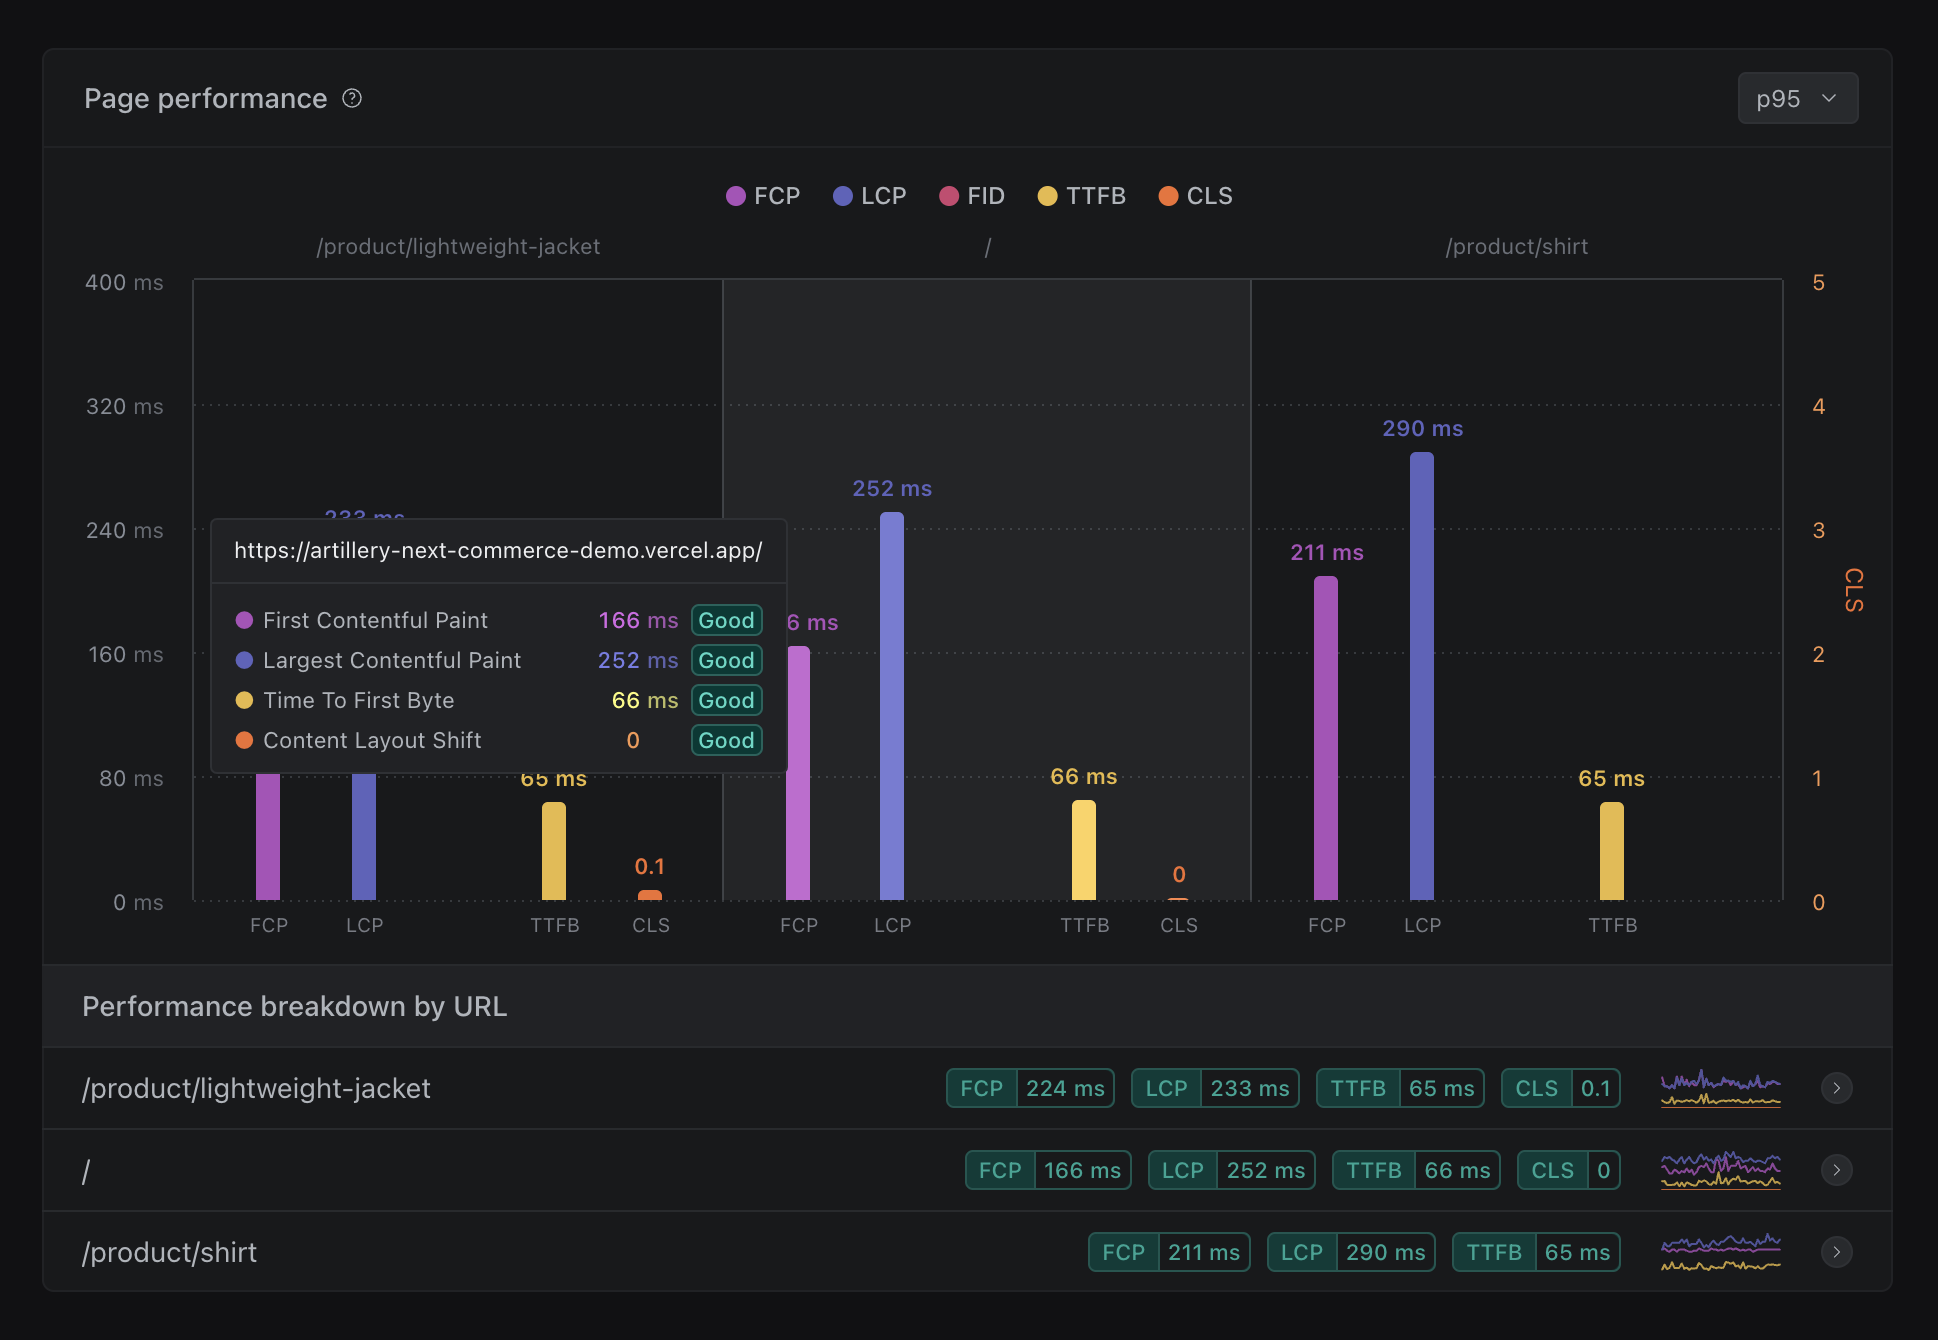
We have updated the colors for the Page performance widget so they are consistent across all charts that have the same metrics. We now show the score (good, fair, bad) for every metric on all tooltips and on also the “Performance breakdown by URL” table.
Metrics explorer improvements
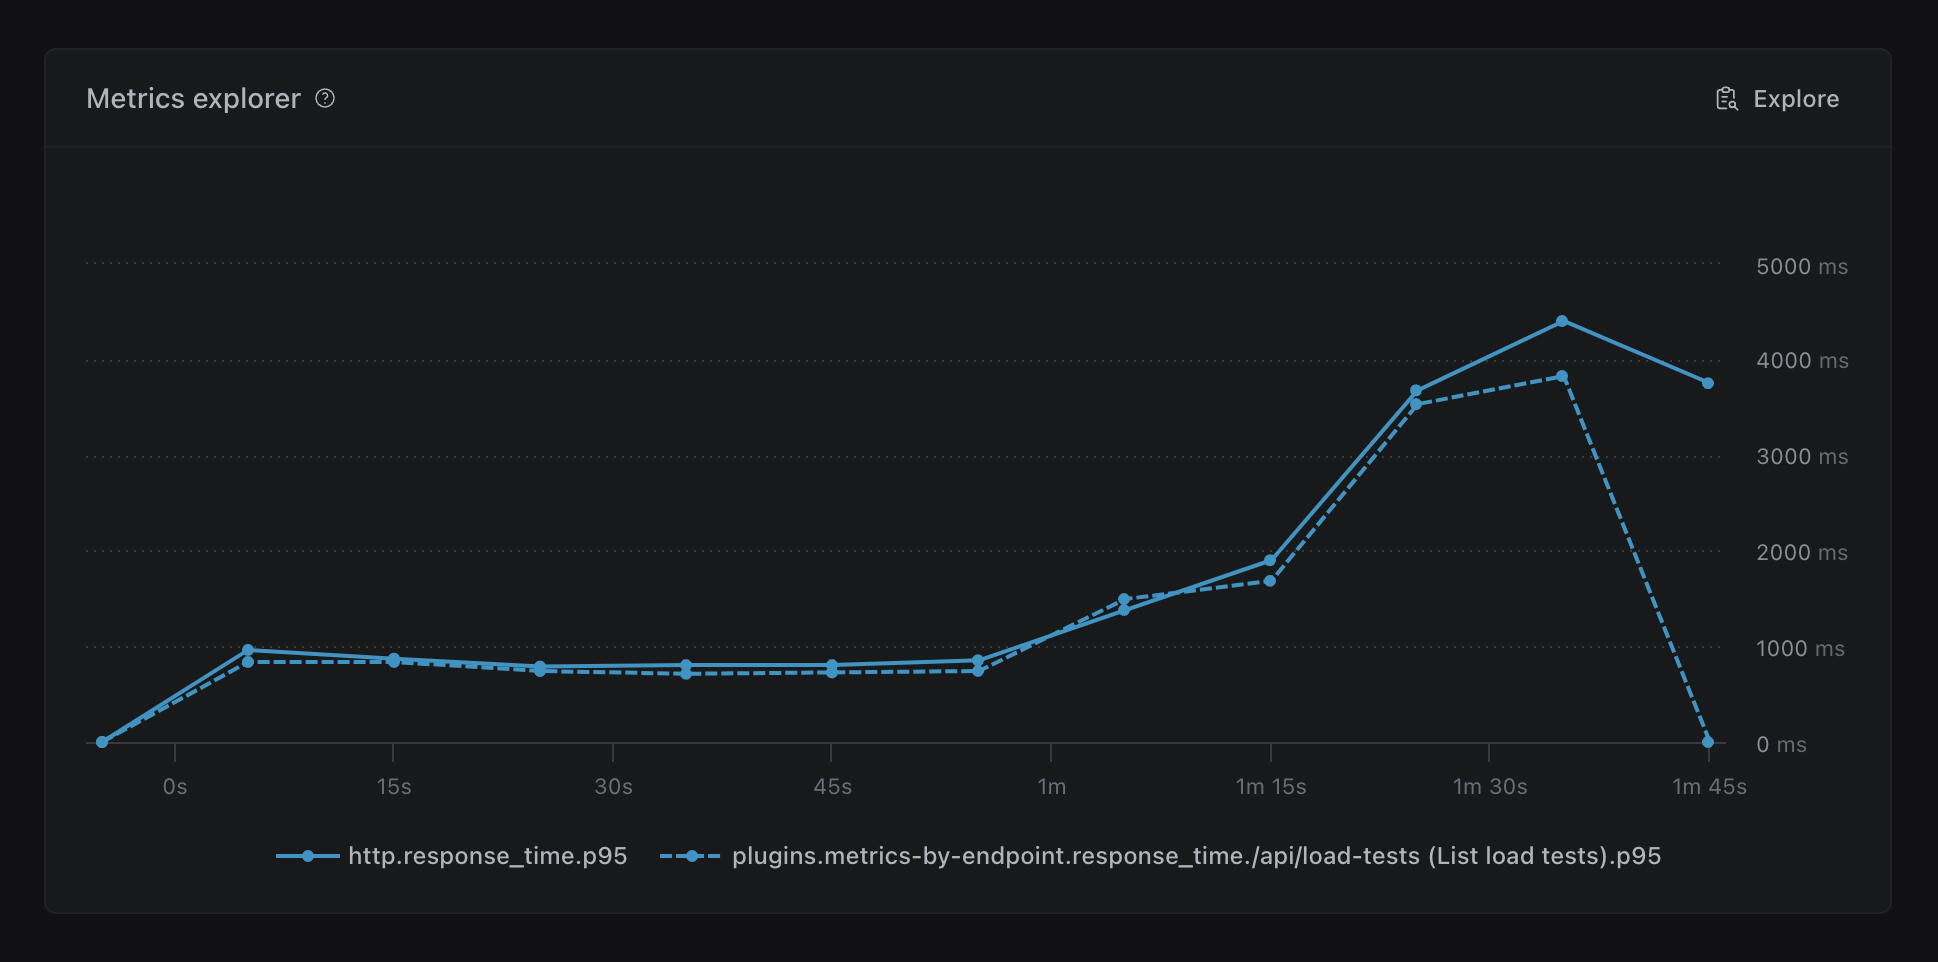
When plotting two separate metrics with the same aggregation (e.g. p95) for comparisons, the series lines now show a distinctive style to improve readability.
You can now see an overview of your team's load testing activity at a glance:
- Total number of load tests run
- Pass/fail rate. A passing test is a test that completed successfully and passed all
ensure checks if any were defined.
- Total number of virtual users created across all tests
- Total running time of all tests
Stats for all time activity are shown by default, but you can also see stats for the last 30 days.
Sometimes you need to stop a test that is currently running. You can now do this directly from the dashboard.
This works for all Artillery tests that run on AWS Fargate, regardless of whether they are triggered from a developer's machine or from a CI/CD pipeline.
This feature requires that Artillery CLI v2.0.1 or later is used to run the test.
The extension is available from the VS Code Marketplace.
New features
- The
artillery-plugin-fake-data plugin will now appear listed under config.plugins, with all different available functions listed to customise their options

config.environments will now have full Intelisense support, with all available config options shown when an environment is listed

- Intellisense support for arbitrary
key:value pairs in:
- HTTP engine:
cookies, headers and form fields
- SocketIO engine:
query and extraHeaders fields
- Websocket engine:
headers field
CLI & Core
- Add time unit support for
think steps in scenarios
metrics-by-endpoint plugin is now enabled by default to capture per-URL metrics in HTTP tests. The metrics will be available only in the JSON report and not output to the console, unless the plugin is loaded explicitly by the user.- Configure CPU and memory for Fargate tests with
--cpu and --memory flags
- Fix issue with
$env not resolving correctly in the config section
- Fix an issue with
--scenario-name not picking up the correct scenario
- Add a new
fake-data plugin to allow for realistic test data to be generated in your tests - docs
- Fix handling of metrics with non-alphanumeric characters in
ensure checks
- Improve error handling in the
expect plugin
OpenTelemetry
- Add experimental tracing support for Playwright tests, with tracing of
test.step() calls, page navigation events, and Core Web Vitals metrics
- Improve conformance to OTel semantic conventions:
- Include error messages for spans with HTTP response codes of
400 or higher
- Include
HTTP_REQUEST_CONTENT_LENGTH, HTTP_USER_AGENT and HTTP_FLAVOR attributes
- Fix issue with virtual user ID attribute (
vu.uuid) not always being set correctly
- Fix inconsistencies in error handling
Playwright
- Add experimental tracing support via OpenTelemetry with
publish-metrics plugin
- Fix
FID Core Web Vital metric not being emitted as expected
ECS/Fargate
- Configure CPU and memory for Fargate tests with
--cpu and --memory flags
Socket.IO
- Allow validation of any number of arguments in response/acknowledge with new
args/on options
- More flexible validations with ability to wait for multiple responses
- Fix issue with displaying
match errors in the report

In order to enhance readability and efficiency, we have made the following updates to charts:
- Add timestamp to chart tooltips
- Improve color contrast for easier data comparison
- Ensure consistent chart colors for each metric across different charts
- Provide metric units on both chart axis and tooltips for better chart understanding
- For charts with multiple axis, the axis takes the color of the metric it represents
- Match the color of the chart series with metrics values on chart tooltips
- Group Apdex metrics into one chart on Reports tab
- Improve spacing around Page performance charts
- Fix a bug with the Page performance widget that affected the formatting of the x-axis
Improve load phase visualization
We have also improved the design of load phases on all charts. Changes include:
- Unnamed
pause phases are now labeled as pause instead of phase #n
- Differentiate the background of
pause phases from regular load phases
- Properly display gaps in data (e.g.
pause phases)
- Resolve an issue where load phase names made it difficult to click the reset zoom button
We have introduced a new HTTP performance widget that displays information for all HTTP requests. This widget offers the following enhancements:
- Display percentages and totals of HTTP requests by status code
- Improve the design of HTTP response time distribution chart
- Show the breakdown of response time distribution over time for individual URLs
- Fix an issue with missing zero values on HTTP response time distribution chart
Display load phase information on all time series charts when you hover over the load phase name.
- Now any errors encountered during the test run will show up in the Errors widget — previously errors would only show at the end of the test run
- HTTP requests and Errors show the percentage against the total number of requests

Page performance chart previews
Show sparkline chart preview of Page performance scores per URL over time. This is useful to help you identify any spikes without needing to expand the chart.

Bug fixes & improvements
- Improve color contrast across the dashboard
- Fix Group by Status test ordering on Load Tests view
New features & improvements
Engines
playwright: Update Playwright version to latest (1.39.0).playwright: Add a convenience test.step() helper, allowing you to break your tests into steps that emit custom timing metrics - Docs.
CLI/Core
- New CLI flag
--scenario-name, allowing you to specify which scenario to run by its name in the test script - Docs.
- Expose
mean as a metric.
- Include scenario object in all engine hooks - you can now access this under
context.scenario - Docs.
Plugins
publish-metrics - OpenTelemetry
- Traces for HTTP requests are now nested under individual scenarios.
- Include all request metrics in traces: dns_lookup, tcp_handshake, tls_negotiation, request, first_byte, download.
- Include VU errors in traces.

Fixes
Artillery Dashboard
- Ensure all Artillery console logs are sent correctly to Artillery Cloud.
- Fix issue with phase information not being sent correctly.
Engines
socketio: Allow nested options (e.g. namespace) in emit without throwing validation error - Docs.socketio: Allow emit action to be an array of strings - Docs.
CLI/Core
fargate: Fix issue with --packages flag.fargate: Include apdex plugin and playwright engine by default in image, preventing additional installation in workers.- Allow unnamed capture groups to be used in
capture.
- Display meaningful error when engine doesn't match the engine provided in
config.engine.
Plugins
apdex - Allow frustrated, satisfied and tolerated metrics to be checked with ensure plugin.apdex - Prevent plugin from crashing when using processor functions.publish-metrics - Set headers as metadata for otel-grpc exporter in OpenTelemetry reporter - Docs.publish-metrics - Create endpoint path correctly so it works with managed instances of Dynatrace.publish-metrics: Fix OpenTelemetry reporter debug logging.
Custom favicons
We have added custom favicons that show the current test status right in your browser tab. Helps you keep tabs on your running tests and for those with multiple tabs opened.

In-progress test view improvements
Improve loading states for HTTP requests and HTTP response distribution widgets.
Bug fixes & improvements
- Fix button not changing to loading state when adding notes
- Fix label alignment of
x axis for time series charts
- Fix HTTP codes widget returning
0 if no data available
- Fix alignment of Page Performance table for tests with missing metrics
- Add zoom functionality to Page Performance charts
- Color HTTP codes on HTTP Requests widget to improve code recognition
- Improve typography for all charts
- Improve quickstart guide copy
Group views make it much easier to scan through your Load Tests page, specially for users that run a high volume of tests. We have added grouping by date, test status, test name, and user.
In-progress test view improvements
We have improved loading states and help copy on Checks, Errors, and Load Summary widgets.
Loading screen improvements
Improve performance of loading screens and update its design.
Bug fixes & improvements
- Improve Load Test page layout
- Improve handling of Cancelled tests on the new Activity widget, now it correctly shows when a test was cancelled or finished early
- Improve Load Test Reports page navigation
- Better visual feedback when submitting notes and editing forms
- Improve Logs toggle icon animation
- Improve Page Performance table responsiveness
- Show more helpful errors in the UI
- Prevent “Filter by Status” from returning Cancelled tests when filtering by Failed
- Fix user avatar aspect ratio on Metadata widget
- Fix incorrect scroll position when navigating through charts in the Load Test Reports page
- Fix number of virtual users not displaying correctly on Load Summary widget
- Fix Notes’ text not wrapping correctly on Notes widget
- Fix display properties flashing between default and user-set properties when changing pages
- Fix error being displayed when session expires, now it redirects to the Login page instead
- Fix button loading states incorrectly triggered when adding or editing notes
- Fix Test Logs area expanding after user collapses it
This update is focused on improving visibility of test phases for tests in progress.
- Improve current test phases visibility for tests in progress
- Outline important test information in a easy to read widget
Improve Test Logs
- Move Worker Logs next to Text log to improve logs discoverability
- Improve Text log loading state by showing CLI loader
- Add auto scroll to Text log
- Improve readability and contrast on Text log widget
- Update Text log to always show scrollbar if content is scrollable
Bug fixes & Improvements
- Improve design of error screens
- Group
vusers metrics under one chart on Test Reports
- Add tooltip to display properties button
- Improve layout of Header and Load Test view on for screen sizes medium and smaller
- Animate Metadata duration to match real-time data elsewhere
- Fix Metadata duration showing
0 for tests in progress
- Fix issue where Text log would show “N/A” on page load
- Fix a bug with tags not showing for some organizations
- Fix page zoom when adding notes to tests on mobile devices
- Fix test list view alignment if user info is not available
This update is focused on many small improvements to improve overall information density and make it easier to understand load testing activity at a glance, as well as to make it easier to analyze individual load test runs.
New features
Test list view
- The results of checks can now be inspected inline. The count of notes added to a test will is now also shown inline.

- Elapsed time is now updated live for in-progress tests

- Display relative dates in the list view, and show the full timestamp on hover

- Tests that run on AWS Lambda and AWS Fargate will now be shown with the appropriate icon for those services

Load test view
- All timeseries charts will now overlay the name of the load phase and show absolute timestamps for X axis labels

- Add metric toggles to for hiding/showing specific aggregations on HTTP Latency Distribution widget

- Make metadata view more compact and easier to scan

- Improve empty states on Checks, Metrics Explorer and Errors widgets

- JSON reports can now be downloaded from the context menu

Bug fixes & Improvements
- The list of tags will now show more tags by default to increase information density
- The
name tag is no longer shown in the list of tags (the name tag sets the name of the test shown in the list)
- Match styling of tags in filter dropdown to styling used elsewhere in the UI
- Fix a bug with date filter not always resetting the selected range as expected
- Fix a bug in date filter where the displayed range could be off by one day
- Fix a bug in date filter where future dates would be shown in date filter
- Fix content overflow on Errors widget when there's a lot of error data
- Fix a bug where filtering by tags would not work correctly
- Fix a bug where filtering by status would not work correctly for tests that included failed checks
New features
- Dynatrace support - the official
publish-metrics plugin can now be configured to send Artillery metrics and events to Dynatrace. Read more in the docs
config.http.defaults - default headers and cookies for all requests in a test may now be set via config.http.defaults
Fixes & improvements
Artillery Dashboard
- Send load phase start/end timings for visualization
- Send CLI exit code to display in test run results
- Fix test run status not always getting reported correctly
- Fix bug which caused test runs on AWS Lambda to not be tagged correctly
Core
- Allow variables set with
--variables to be used anywhere in config
- Fix for encoding of array values in query strings
- Make sure CLI exit handlers are always run
- Fix bug affecting match groups in regexp captures
Plugins
publish-metrics - Exit early if required config is missing for publish-metricspublish-metrics - Reduce memory usage of the pluginexpect - add useRequestNamesOnly optionensure - fix bug where ensure config under config.plugins.ensure would not get picked up
We've reorganized the layout of individual test reports to make notes more prominent, improved readability of the metadata section, and created more room for useful visualizations in the main area.
Notes
Notes provide a way to annotate test runs with useful information such as links to external logs and dashboards, and for recording results of investigations into performance issues found by load tests.
We've now pulled them out from a separate view to make them more accessible.
Other fixes & improvements:
- Remove shadow overlap on first note
- Tweak microcopy to make actions clearer
- Test timing information has been moved into the sidebar to give more space for data widgets in the main area
- Make Metadata section collapsible
- Improve spacing on list of CloudWatch Log Streams for Fargate tests
- Move "Add note" to the top so notes are added right below it, better UX
- Tweak styling of rendered Markdown for better readability
- Improve handling on small screens
- Improve alignment and padding of metadata items
Load test visualizations & insights
- Fix issue that could cause all charts to rerender when not necessary and lead to charts jumping around
- Improve responsiveness of Page Performance widget
- Improve spacing on Error summary view
- Add empty state to Counters summary
- Test IDs can be copied by clicking them
Other fixes & improvements
- Fix bug that could cause new tests to show up as "Untitled Test" for a short period of time
- Fix bug that prevented deep links to charts from working
- Error dialogs and error handling. Error responses in both the UI and API will now include unique error IDs that are tied to error logs
- Fix bug that would cause some pages to show loading skeleton indefinitely for logged out users
- Fix alignment of loading indicators on buttons across the app
- Improve contrast for all popovers and dropdown menus across the app
- Make styling of all external links consistent through the app
- Remove banding on the gradient in the header
See how Core Web Vitals change under load
You can now see Core Web Vitals measurements for an entire test run, and understand how user experience is affected by high load.

We have added the ability to switch between p99, p95 and median aggregations for visualizing Core Web Vitals metrics.
Other improvements
- Improved layout and spacing for tooltips and charts
- Improved handling of overlapping text.
- Improved readability with tweaks to x axis labels and URL formatting
- Improved toggle interactions and animations
New quickstart wizard
We have added a new quickstart wizard which lets you go from first sign-in to running a load test in 3 steps.

Other fixes & improvements
- Display the user who triggered a test in the metadata sidebar
- Add option to display the user who triggered the test in the test list view
- Fix issue where dialogs could close themselves accidentally
- Fix incorrect default labels on some charts
- Improve default error pages
- Fix regression on response time widget displaying an unnecessary count metric
Core Web Vitals is a set of key frontend performance metrics that measure user-perceived performance of a web application.
The dashboard will now visualize the performance of every page for load tests that use Artillery's Playwright integration. This will help you understand how user-perceived performance is affected by high load.

Fixes & Improvements
- Add syntaxt highlighting on JSON report views
- Tail text logs for in-progress load tests
- Replace popover with inline editing for notes
- Notes can now be posted with Ctrl + Enter
Apdex scores
The load test summary view will now calculate and display Apdex scores for load tests that make use the built-in apdex plugin.
Apdex (Application Performance Index) is an open standard for measuring performance of HTTP services. The Apdex score converts response times into a single score that reflects user satisfaction with the service.
Fixes & Improvements
App-wide
- Update colors to improve legibility and consistency
- Add exit animations for all dropdown-like elements
- Improve loading states on all buttons
- Improve consistency of dialogs everywhere
- Improve consistency of spacing between elements across the app
Main view
- Tweak the display of Artillery’s logo in the navbar
- Fix responsiveness on Load Tests view
- Improve UX for Saved Views and the Filter Bar with long input strings
- Match test run ID icon in filter dropdown to one used elsewhere
Load test view
- Make font sizes consistent in metadata panel
- Improve styling of text log view, JSON log view, and table components
- Fix issue with loading default CLI avatar images on notes
- Fix issue with scroll gradient covering first note in the notes list
- Improve spacing on Edit Note dialog
Charts
- Add intelligent X axis scaling depending on duration of the test
- Improve Y axis layout on Load Summary chart
AWS Fargate support
This release adds support for running tests on AWS Fargate. Scale out your load tests horizontally from any of the six supported regions.
artillery run-fargate --count 10 --region us-east-1 my-script.yml
Supported regions:
us-east-1us-west-1eu-west-1eu-central-1ap-south-1ap-northeast-1
AWS Fargate is a serverless solution that requires no infrastructure to be managed, and unlike AWS Lambda does not impose a restriction on the duration of your load tests.
Artillery's Playwright integration is fully supported on Fargate, to let you run browser-based load tests at scale with ease.
Playwright support
Playwright support is now built into Artillery. The integration in artillery-engine-playwright is now bundled into the Artillery CLI.
- The version of Playwright used by the integration has been updated to v1.3.4
- Web Vitals tracking has been improved to provide more accurate measurements
- Playwright scenario file may now be loaded via
testFunction attribute rather than flowFunction
flow attribute may now be omitted in Playwright engine scenarios
Other fixes & improvements
- Pass
lambdaRoleArn to AWS Lambda engine correctly
- Fix issue with returning matched groups from regexp capture
- Track & report downloaded data in HTTP tests via
http.downloaded_bytes metric
- Environment variables may now be accessed through the special
$env variable (the current way of accessing those via $processEnvironment is still supported but will be deprecated in future)
- Dependency updates to address deprecation and security notices

The main load test list now shows the results of ensure checks so that you can see at a glance which tests succeeded and which ones did not meet performance thresholds.
We recommend using ensure checks for all regular tests to help make sure that performance goals are met.
Simplified status filters
We have reduced the number of status filters down to just four: Succeeded, Failed, Cancelled, and In Progress. A test run that sets ensure checks is marked as Succeeded only if all checks are successful.

A fresh lick of paint
We have done a comprehensive overhaul across the whole interface of the application, updating component surfaces, font sizes, animations, and more, to make the UI feel more consistent, accessible, and easy on the eyes.
Settings management

The Settings area has been updated to make navigation easier and now includes the ability to edit organization and personal details.
It's now also possible to pick a "system theme" which makes our UI follow your operating system's light/dark theme.
Fixes & improvements
- Performance improvements: faster loading of individual load tests, and settings pages
- Fix bug with searching by test run ID that would cause older test runs to be omitted
- Make Settings navigation fully responsive on mobile
- Add infinite scroll for the main load test list view
To make getting to the information you want faster, the dashboard supports Saved Views now. Any combination of tag filters, date filters, and test status filters can be named and saved as a view.

Team member and auth management
You can now manage current team members, and the GitHub allowlist that determines who may join your organization from the Settings area.
Live test updates
Overview pages are now live and can be used to follow the progress of an in-progress load test.
Denser and more scannable list view
We improved information density and scannability of the main load test list view. The default page size has also been increased from 10 to 50.
API key management
Create API keys to use with the Artillery CLI or to create custom integrations with Artillery Cloud.
We spent a lot of time on refactoring and optimization. End result: a leaner, snappier and more responsive UI.
Fixes & Improvements
- Show the name of current organization in the header
- All execution platforms can send data to the dashboard now - local, AWS Lambda and AWS ECS/Fargate
- Allow flash messages to stack
- Improve responsiveness of side navigation on test reports
- Add tooltips for tags in the main list view
- Fix bug with the direction of the arrow on the user dropdown menu
- Match loading skeletons with layout across the app
- Make dialog entry/exit animations consistent
- Fix dialogs not showing if page height was larger than viewport size
- Fix bug when active tab inside load test view would not be highlighted correctly
- Improve spacing, grid styling, and tooltip styling on all charts
New features
- AWS Lambda - when running tests on AWS Lambda, Artillery will automatically bundle any plugins loaded via
config.plugins and engines loaded via config.engines
- Checks & assertions: new
notStatusCode check in the expect plugin
- Datadog integration:
includeOnly and excluded options may be used to configure the list of Artillery metrics which will be sent to Datadog
Fixes & improvements
- When
artillery run is used with the --output option, Artillery will check if destination exists before running the test
- Miscellaneous dependency updates to address deprecation warnings and security advisories
We have released Artillery v2.0.0-28, which adds support for AWS CloudWatch, and features a number of performance and stability improvements.
(GitHub release page: https://github.com/artilleryio/artillery/releases/tag/artillery-2.0.0-28)
Breaking changes
- AWS Lambda: the default IAM role and policy are now versioned. If you attached any custom permissions to the
artilleryio-default-lambda-role role, you will need to re-attach it to the new artilleryio-default-lambda-role-20230116 role
- CLI: The
probe command has been removed from the CLI. The functionality has been moved to the new Skytrace CLI
New features
- Add support for publishing test metrics to AWS CloudWatch
- HTTP - compressed responses (e.g.
gzip) will be decompressed by default now. (Set gzip: false to disable automatic decompression if required to improve performance.)
- CLI - suggest closest match if a command name is mistyped
AWS Lambda
- Print custom role ARN if provided
- Add versioning to default Lambda role and policy created for running tests
Fixes & improvements
- Fix arrival phases with
arrivalRate and rampTo set to 0
- Improve
rampTo logic to result in more predictable and deterministic ramps
- Fix issue with
maxVusers setting that would lead to unexpected number of VUs to be generated
- Fix wildcard message handling support in Socket.io
- Fix issue with setting some properties on the global
artillery object
AWS Lambda
- Improve test startup logic: workers will wait for each other to be ready before kicking off the test run
- Fix some intermediate metrics not being flushed & reported
- Fix handling of
memory-size and security-group-ids options
We have released a big update to the Artillery Dashboard with a focus on improving the Overview section and our charting engine to let you understand load test results faster.
Load Test Overview
- Show Peak RPS achieved during a load test run
- Display errors (if any) at the top of the screen
- New "Load Summary" chart to visualize request rate, response time, and VUs created across the test run

- Show a breakdown of HTTP codes by URL

- New "Metric Explorer" widget to let you chart and compare any metric (including custom metrics) generated by the test run

Fixes, Tweaks and Polish
- Layout: tweaks to spacing across the board to increase information density and make more room for what matters. Improved layout of the main test list view and individual test views.
- Charting: ability to combine multiple metrics on one chart
- Charting: show combined tooltips for each point along the time axis
- Fix for sidebar and main area overlapping at some screen sizes
- Fix issue with flash messages disappearing from view
- Improve tag list display in the main list view
New Overview section
The new Overview section provides at-a-glance view of what happened during a load test, including:
- Status of
ensure checks.
- A summary view of all errors raised during the test (if any), such as request timeouts, dropped TCP connections etc.
- A summary view of HTTP codes, HTTP request rate, and response time distribution (
min, max, p999, p99, and p95).

Notes
Capture the results of performance investigations and link to relevant external resources such as Datadog dashboards, Kibana logs, or JIRA tickets. With full Markdown support, and ability to post notes via the CLI.

Charting improvements
- Color palette improvements to improve readability
- Fixed an issue with displaying charts for tests that generate a lot of data, such as 8-12 hour long soak tests
- Fixes to zooming and panning
Light mode
And finally, if dark mode isn't your thing, the dashboard has a light mode now. Toggle it on via Profile -> Light Mode.
Artillery CLI
New HTML reports
We have improved the layout and styling of reports generated with artillery report.

--dotenv flag
You can now load environment variables from a file with the --dotenv flag. Those env vars are available in Artillery scenarios through the $env variable.
Dashboard
Visual polish
- Improved homepage responsiveness
- Updated load test table with new context tags and new flexible tags
- Updated context menus
- Updated header styling in load test view.
- New and improved selected tags filter bar
- Show loading skeletons while data is being fetched
CDK installer
We released an official AWS CDK-based installer for Artillery dashboard.
https://github.com/artilleryio/installer-aws-cdk
Flexible deployment modes
The dashboard can now be deployed in more than one way to fit the exact requirements of your organization:
- As an internal-facing, inside a VPC. This is the default deployment mode, and it will require an existing VPN setup to access the app. TLS is optional with this setup.
- As a publig public-facing, which requires TLS with a pre-provisioned ACM certificate.
- Custom domain may be configured on top of the provisioned ALB DNS name.
GitHub Authentication
We added support for authentication through GitHub.
Aurora Serverless v1 Support
An Aurora Serverless database cluster may now be used as the backing store for Artillery Pro.
This requires Data API to be enabled on the cluster. Only Aurora Serverless v1 is supported right now.
Dashboard

Fixes & Improvements
- Improve loading states on the Settings screen
- Fix bug with context menu getting cut off
- Fix double-trigger on context menu buttons
Artillery Pro
Artillery Pro v3.0.0-10 has been released (full changelog)
New
- Add support for loading enviroment variables into workers from a .env file with
--dotenv flag
- Include extra information in JSON reports: test metadata, test run ID, and ensure check results
- Include launch platform and subnet information in environment summary output
- Test runs are automatically tagged with
test_run_id tag, which is set to the test run ID
- Print test run ID at the end of the test run
Fixes & Improvements
- Exclude raw histogram data from JSON reports to reduce file size
- Fix an issue which could prevent ensure checks from running
- Fix an issue where only one
--secret flag would be taken into account
- Show auto-guessed subnet IDs when subnets aren't set explicitly with
--subnet-ids in run-test
Dashboard
A long requested feature of our dashboard has been the ability to login with GitHub. A layer of authentication removing the need for VPN's on your end.

With the latest we're shipping:
- Authentication
- Fixed a bug relating to Load Test table horizontal scroll.
- Load tests now fail a little more gracefully with more robust checks for data.
- Also improvement on empty states when a Load Test is firing up.
Artillery Probe
- Added querying for XML/HTML responses with Cheerio
Kubectl
- Latest release of Kubectl plugin is out now! Find it here.
Artillery Probe
We have launched the first version of Artillery Probe, a smart and user-friendly HTTP client built into Artillery

- Send HTTP requests from the command line
- Send JSON, arbitrary request bodies, set custom headers, querystrings, forms, and more
- See request performance waterfalls
- Syntax highlighting for responses
- Query JSON responses with JMESPath
- Set expectations and checks on the command-line for quick acceptance testing and smoke testing
More details on our blog: https://www.artillery.io/blog/swiss-army-knife-for-http-testing
Artillery Probe is available in the most recent release of Artillery:
npm install -g artillery@latest
Artillery CLI
- Improve validation of test scripts
- Add
wait action to WebSocket scenarios
- Fix an issue with aggregating summary metrics under certain conditions
Detailed changelog for the CLI is available on https://github.com/artilleryio/artillery/releases
Dashboard

- Improve test status indicators
- Fix issue with tooltip positioning on metric charts
- Fix keyboard navigation in tag search dropdown
Website and Docs
- Typography & readability improvements
Docs

- Documentation search is now available
- A whole lot of polish to improve readability: layout, typography, colors, layout & spacing
- Need to get to the docs quickly? Try docs.art
Dashboard
Polish & fixes:
- Add horizontal scrolling to the main load test view when the number of column exceeds display size
- Load test view: clicking on tag in the sidebar will filter for that tag
- Order of charts in the sidebar matches that on the page
- Fix Y-axis overflow in load test list view
- Fix bug with allowing duplicate tag selection
- Fix "Copy JSON" button on load test report view
- Fix for an exception shown when some metrics from a test run are missing
- Fix spacing between tags in load test view
- Fix filter icon colors
- Fix styling of "clear" button in tag filter component
Artillery CLI
- Fixed issue with saving large test run results produced by long-running (8+ hours) load tests
- Fixed issue with aggregating summary metrics at the end of a test run under certain conditions
- Add
--max-duration flag to run-test command to set a limit on running time of a test
- Handle Fargate throttling when launching multiple large load tests in parallel
Artillery Operator
New kubectl plugin! Use `kubectl artillery scaffold' to scaffold tests for existing Kube services. Available from GitHub releases on https://github.com/artilleryio/artillery-operator/releases/tag/v0.1.1
Dashboard
Delete load test results
Sometimes you don't need to keep a test result around - maybe the run did not complete and you don't need the report, or perhaps you ran the test in the wrong environment and the results are meaningless. Whatever the reason, you can now delete test results you don't need.

In case you missed it in the previous changelog, this can be done from the CLI too with the - Add delete-test-run command.
Artillery CLI
Artillery v2.0.0-13 has been released:
Dashboard v0.5.0
(Artillery Pro Dashboard is in early beta with a small number of Artillery Pro customers. If you'd like to join the beta, please let us know via team@artillery.io)
Last week we made a few changes focused on improving querying & filtering, providing more context around test run data, and adding a bit of extra polish.
More powerful filtering
You can now search & filter by:
- tags
- date range
- status
- or a combination of the above
We also improved the tag filtering input and made tag filter query easier to read.

Customize main load test view
You can now customize the columns shown in the main load test view to be able to find what you're looking for faster.

We've exposed more metadata for test runs in the sidebar. You can now see more information for each test run now, such as:
- Full
artillery command used to trigger the test run
- CPU and memory configuration for the workers
- Version information for Artillery CLI used to trigger the test
- Names of secrets used by the test run

Progress indicators
Sometimes filtering and searching can take a bit of time, especially for more complex queries. We've added loading indicators in a few places to make it clear that the UI is busy doing the thing you asked it to do.

Fixes
- Fixed bug which would cause the view to scroll to the top when viewing Notes
- Fixed "Finished at" time being shown incorrectly for tests which are in progress
Artillery Pro v3.0.0-6
- Add
delete-test-run command
describe-test-run returns extra metadata about a test run:
- cliArgs - full CLI args that a test was run with
- secrets - names of secrets passed to the test run
- platformConfig - platform-specific configuration, e.g. CPU and memory config on Fargate/ECS
Welcome to our brand new changelog where we will keep you updated on new releases, features, fixes and improvements in our products.
Artillery Pro Dashboard
Searching & Filtering
You can now filter the list of load test results by multiple tags.

You can further refine a tag filter with test status. For example to show all test runs tagged with team:sre and service:checkout-service which did not complete successfully.
Chart navigation
You can now jump straight to a chart for a specific metric from the sidebar.

Zooming and panning
We added support for zooming and panning to metric charts.

Update notifications
When a new release of the dashboard is available, the app will show a notification in the top-right corner, along with a link to the changelog and upgrade instructions.

Kubernetes Support
We have released an early preview of the Artillery Operator for Kubernetes. The goal of the project is to make Kubernetes-specific workflows easier with Artillery. We'd love to hear your feedback, comments, and suggestions.
Read the announcement on our blog: https://www.artillery.io/blog/artillery-operator-alpha-announced